


back
to top
project overview
BCAA is a leading insurance provider in British Columbia offering auto, home, travel, small business, and pet insurance. I worked with the marketing team to manage ongoing digital ad campaigns across Google, Facebook, and YouTube — from creative design to data analysis and optimization.
goal
The goal of BCAA digital campaigns are to deliver performance-focused marketing that aligned with brand values while achieving measurable results, such as website visits and product sales numbers.
my role
Graphic Designer and Digital Marketing Specialist (creative design, multi-platform ad deployment, bi-weekly data reporting & optimization)
timeline
Ongoing
tools
Adobe Creative Suite, Corel Draw, Google Sheets, Google Analytics, Looker Studio, Meta Ads Manager, Google Ads Manager
example case: 2025 BCAA home insurance Chinese marketing campaign
One of BCAA’s core product lines is home insurance, which includes multiple categories. For this campaign, the focus was to increase awareness and acquisition for both home owner insurance and renter insurance among Chinese-speaking audiences in British Columbia.
Goals and Measure of Success
Achieve at least 13,000 total website visits during the campaign period.
Increase home insurance website traffic by 30% and home insurance quotes by 10% compared to the 2024 campaign.
Target Audiences
Age: According to 2021 Statistics Canada data, the majority of homeowners in British Columbia fall between 40 to 75+ years old, with a median age of approximately 55.
Gender: Male and female.
Locations: British Columbia, with priority cities including Vancouver, Burnaby, Richmond, Surrey, Langley, and Coquitlam.
Income: The average household incomes for home owners or renter are difficult to pinpoint, but according to research, the average income needed to qualify for a mortgage in Greater Vancouver is around $225,000 to $287,000.
Media Platform: According to a survey done in 2020 by Statistics Canada, the most popular media in Canada are internet (80%) and television (67%), followed by radio (40%) and newspaper (36%).
Languages: Since this campaign targeted Chinese-speaking communities, creatives were adapted into Simplified Chinese, Traditional Chinese, and Cantonese where appropriate.

Homeownership rate data from Statistics Canada
Timeline
1-month campaign period.
Design Focus
To effectively promote the two product types—home owner insurance and renter insurance—I developed two separate digital ad campaigns, each with its own set of visuals and tailored messaging.
Although the campaign mainly focused on digital media, demographic insights indicated that many Chinese-speaking audiences (40 to 75+ years old) in Greater Vancouver also actively consume traditional media such as newspapers and radio.
To strengthen overall reach, I additionally designed print ads for two Chinese-language newspapers and recommended collaborating with a local Chinese radio station to produce a 30-second radio clip for this segment.

Static Ads on Facebook and Google
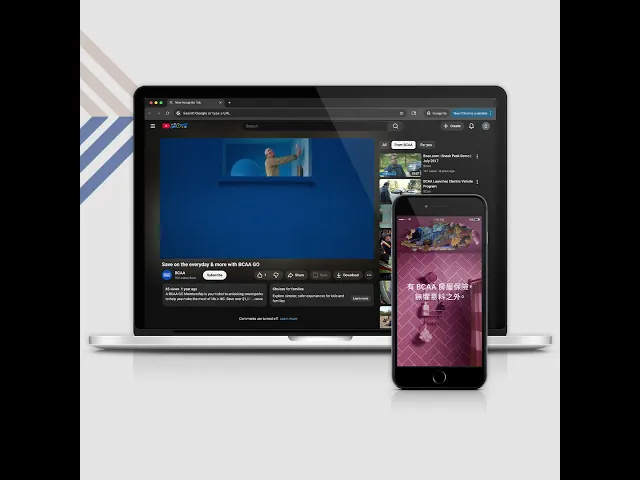
Video Ads on Facebook and Youtube

Print Ads on Newspaper
Key Results Summary
Overall Goal Achievement
he primary campaign objective was to generate at least 13,000 website visits across Facebook and Google platforms.
By the end of the campaign period, total traffic exceeded expectations—achieving 42% above the original goal, demonstrating strong performance across both paid channels.
Platform-Level Year-Over-Year Improvements
Compared with the 2024 Home Insurance Campaign, this year’s campaign achieved significant YoY improvements:
Google Display Campaign Performance
✔ 104% increase in link clicks compared to 2024 (more than double last year’s performance)
✔ Strongest improvements seen after Week 3 optimization, including keyword refinement and adding new video assets
Facebook Campaign Performance
✔ 13% increase in landing page visits compared to 2024
✔ CTR improvements across both Home Owner and Renter ad groups, supported by creative refresh and weekly optimization adjustments
Lead Quality & Final Business Outcome
Beyond traffic and engagement metrics, this year’s campaign drove meaningful improvements in bottom-funnel performance:
✔ Delivered 650% increase in home insurance quote submissions compared with 2024 (a 6× growth)
✔ Successfully generated 1 confirmed Home Insurance sale directly within the campaign period — a result that did not occur in the previous year’s campaign
✔ Indicates not only higher traffic but also stronger conversion intent and improved lead quality
Platform-Level Performance Improvement Summary - Facebook
Overview
Over the one-month campaign period, both Home Owner and Renter campaigns ran with two creative formats: static banners and in-feed video / reel ads. Performance was monitored weekly, and optimization actions were taken every 10–14 days to control frequency, reduce cost per result, and improve overall engagement efficiency.
Optimization Actions Taken
✔ Re-aligned the Campaign Objective (Week 1 → Week 2)
Changed the conversion goal from “Link Clicks” to “Landing Page Views” to improve audience optimization accuracy.
✔ Paused Some of the Static Ads to Control High Frequency (Week 3)
When frequency exceeded the expected range, static ads were paused for 3 days to avoid creative fatigue, wasted impressions, as well as rising cost per result. Budget was redirected to videos during the pause period.
✔ Restarted Paused Static Ads After Rebalancing (Late Week 3)
Once CPM stabilized and video performance plateaued, static ads were restarted to maintain healthy creative mix.
✔ Audience Retargeting (Week 4)
Retargeted users who previously viewed videos or clicked static ads to further lift conversion efficiency in Week 4.
✔ Weekly Budget Reallocation
Shifted up to 15-30% of weekly budget depending on: CTR changes, cost per landing page view, creative fatigue, as well as platform delivery behaviour (such as in-feed ad placement and story / reel ad placement).
Key Improvements Across the Campaign
✔ Lower Cost per Result (Chart 1)
After optimization on Week 3 and Week 4, the cost per result dropped by 17 - 19%, which largely driven by:
shifting budget toward the better-performing creative format
reducing unnecessary frequency spikes
retargeting user groups

Chart 1 - Cost per Results Changed By Weeks (Indexed)
✔ Higher CTR (Chart 2)
From Week 1 to Week 4, CTR increased by approximately 0.65 - 0.97 percentage points for both campaigns. Also, CTR increasing by around 20 - 60% after reallocating budget.

Chart 2 - CTR Changed By Weeks
✔ Higher Engagement Rate (Chart 3)
Video creatives consistently outperformed static ads in both CTR and engagement, with engagement rate improving week-over-week as the system learned user behaviour

Chart 3 - Engagement Rate Changed By Weeks
Insights
Video creatives consistently deliver stronger CTR and engagement.
Static ads perform well at lower CPM but fatigue faster, making them more suitable for short-burst reach pushes.
Controlling frequency prevents cost from rising. Frequency monitoring is critical for campaigns that run longer than 2 weeks.
Retargeting highly engaged audiences helps increase lower-funnel results, especially for insurance products requiring more consideration.
Platform-Level Performance Improvement Summary - Google
Overview
Over the one-month campaign period, both Home Owner and Renter campaigns ran using Display campaign types across all Google ad platforms, incorporating both static images and video creatives.
Similar to the Facebook campaigns, performance was monitored on a weekly basis, and optimization actions were taken every 10–14 days to reduce cost per result and improve overall engagement efficiency.
Optimization Actions Taken
✔ Added More Video Assets (Week 3)
Produced additional 1920 × 1080 video clips for YouTube placement to enhance overall engagement and drive stronger CTR performance.
✔ Adjusted Keywords and CTA in Ad Content (Week 3 - 4)
Using weekly data pulled from the ad manager dashboard, keyword variations and on-image text/CTA were revised for each display ad grouping to improve CTR and stabilize the rising cost per result.
✔ Weekly Budget Reallocation and Monitoring
Monitored and adjusted daily budgets each week for improved cost control and to ensure campaigns stayed within overall monthly spending limits.
Key Improvements Across the Campaign
✔ Higher CTR (Chart 4)
From Week 1 to Week 4, CTR increased by approximately 1.21 - 1.22 percentage points for both campaigns.
Additionally, after adding new video creatives to the YouTube placements, CTR improved significantly, rising by approximately 55% - 70% depending on the ad group.

Chart 4 - CTR Changed By Weeks
Insights
Video formats drove stronger engagement. After adding additional video assets in Week 3, both campaigns experienced noticeable CTR lifts (up to 55%–70%), showing that video placements on Youtube were more effective across Google Display channels.
Weeks with higher CTR indicated that creative quality and keyword tuning had positive effects on ad delivery.
Weekly budget reallocations helped control spending and ensured impression consistency, though weeks with reduced budgets (Week 4) often showed higher CTR but slightly higher cost per result due to smaller audiences.